
Decision support
What is e-commerce reporting and sales analytics?
E-commerce reporting turns order, sales, product and channel data into useful indicators so teams can understand performance and identify opportunities.
Revenue alone never tells the whole story: cancellations, returns, product mix and changes over time all matter.
One perspective
Bring multichannel sales information into focus
Reviewing operational data from a storefront and connected marketplaces in a consistent way can reduce the effort of switching between separate dashboards.
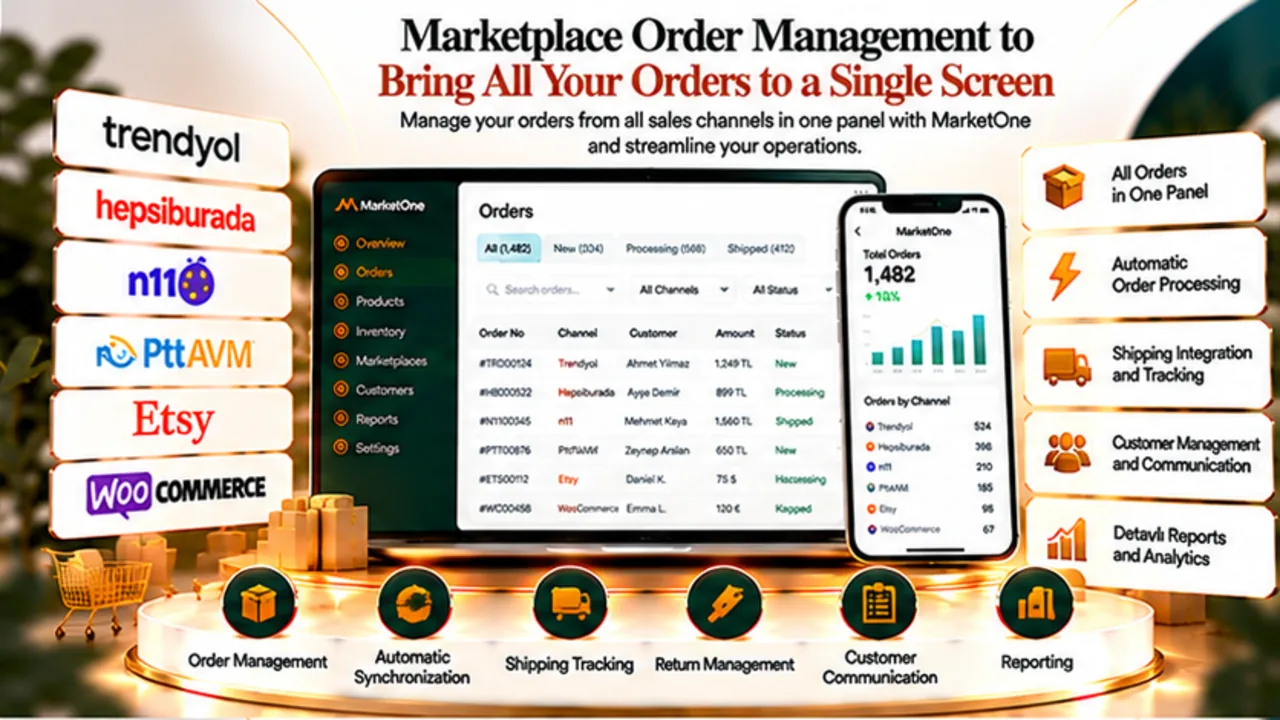
Available fields can vary across Trendyol, Hepsiburada, N11, PttAVM, Etsy and WooCommerce integrations.
Time periods
Compare daily, weekly and monthly sales trends
Examine changes in order volume and sales value over comparable periods to spot seasonal patterns and unusual movements.
Consider returns and equivalent periods before treating a short-lived spike as sustained growth.
Channel mix
Understand the contribution of each sales channel
Channel-level analysis helps identify where different products perform best and where operations may need attention.
Compare fees, shipping and returns alongside sales volume.
Product insights
Evaluate product and category performance
Look at best-selling products, slower-moving inventory and category-level trends together.
A high unit count does not necessarily mean high profitability after discounts and costs.
Core metrics
Revenue, order count and average order value
Revenue and order volume answer different questions. Average order value is typically calculated by dividing an appropriately defined sales total by the relevant order count.
Apply consistent rules for taxes, discounts, shipping, cancellations and returns.
Order count
Revenue and order volume answer different questions. Average order value is typically calculated by dividing an appropriately defined sales total by the relevant order count.
Average order value
Revenue and order volume answer different questions. Average order value is typically calculated by dividing an appropriately defined sales total by the relevant order count.
Return rate
Revenue and order volume answer different questions. Average order value is typically calculated by dividing an appropriately defined sales total by the relevant order count.
Channel mix
Revenue and order volume answer different questions. Average order value is typically calculated by dividing an appropriately defined sales total by the relevant order count.
Operational health
Include cancellations and returns in your analysis
Cancelled and returned orders help explain the difference between booked demand and completed sales.
Break return patterns down by product, channel and period when the data is available.
Inventory context
Read stock movements alongside sales velocity
Fast-moving products may run out, while slow-moving items tie up working capital.
Linking inventory and sales information supports more informed replenishment decisions.
Campaign review
Assess what changed during promotions
Compare sales before and after campaigns while considering traffic, order count, basket value and returns.
Seasonality and advertising spend may also influence the outcome.
Profit perspective
Separate sales revenue from profit
Gross sales are not net profit. Product costs, marketplace fees, shipping, payment charges, returns and taxes must be considered separately.
Confirm which cost inputs are actually available before relying on profit calculations.
Behaviour insights
Use Google Analytics 4 for additional context
When correctly configured, GA4 can provide context on traffic sources, product interactions and the shopping journey.
Analytics events and back-office orders may differ in scope and measurement; reconcile discrepancies.
Management focus
Choose KPIs that support decisions
Revenue, order count, average order value, return rate, channel mix and inventory turnover are useful only when aligned with your goals.
A focused set of reliable metrics is often more actionable than a crowded dashboard.
Workflow
Manual spreadsheets versus centralised reporting
Multiple exports and dashboards make consistent comparisons harder. A central approach can establish a clearer routine for reviewing performance.
Freshness and depth of reporting depend on connected channels and configuration.
| Manual process | Central approach | |
|---|---|---|
| Data gathering | Separate dashboards and spreadsheets | Shared review workflow |
| Comparison | Definitions can vary | More consistent metrics |
Use cases
Sales analytics across different retail sectors
Fashion sellers may review size demand, electronics sellers product-family performance, and spare-parts suppliers low-volume critical inventory.
Adapt analysis to your catalogue, sales cycle and business model.
Getting started
Prepare your reporting workflow
Define the decisions you want to make, then clarify data sources, periods, currencies, return policies and access permissions.
Standardised product and channel naming makes reports easier to compare.
Reporting checklist
✓ Included data sources
✓ Time period and currency
✓ Returns and cancellations
✓ Costs and fees
✓ Permissions and data validation
FAQ
Frequently asked questions
What is e-commerce sales reporting?
It is the structured analysis of orders, sales, products and channels to support business decisions.
Do all marketplaces expose identical data?
No. Available fields depend on each marketplace API and the active integration.
Is revenue the same as profit?
No. Profit also depends on costs, fees, shipping, returns and other expenses.
How often should reports be reviewed?
Operational metrics may need frequent checks; weekly and monthly comparisons support broader decisions.
Why can GA4 and order figures differ?
Consent, attribution, processing delays and the treatment of refunds or cancellations can cause differences.
Where can I explore MarketOne reporting?
Review the product page and confirm the reporting coverage relevant to your operations.
MarketOne
Explore related solutions
MarketOne
See your sales operation more clearly with MarketOne
Explore multichannel operations and supported reporting options on the product page.